Every good production environment needs robust monitoring in-place before it could be considered production and I feel like my homelab shouldn’t be an exception.
With that in mind, I created a monitoring stack that I’ve used professionally and I’m pretty happy with it.
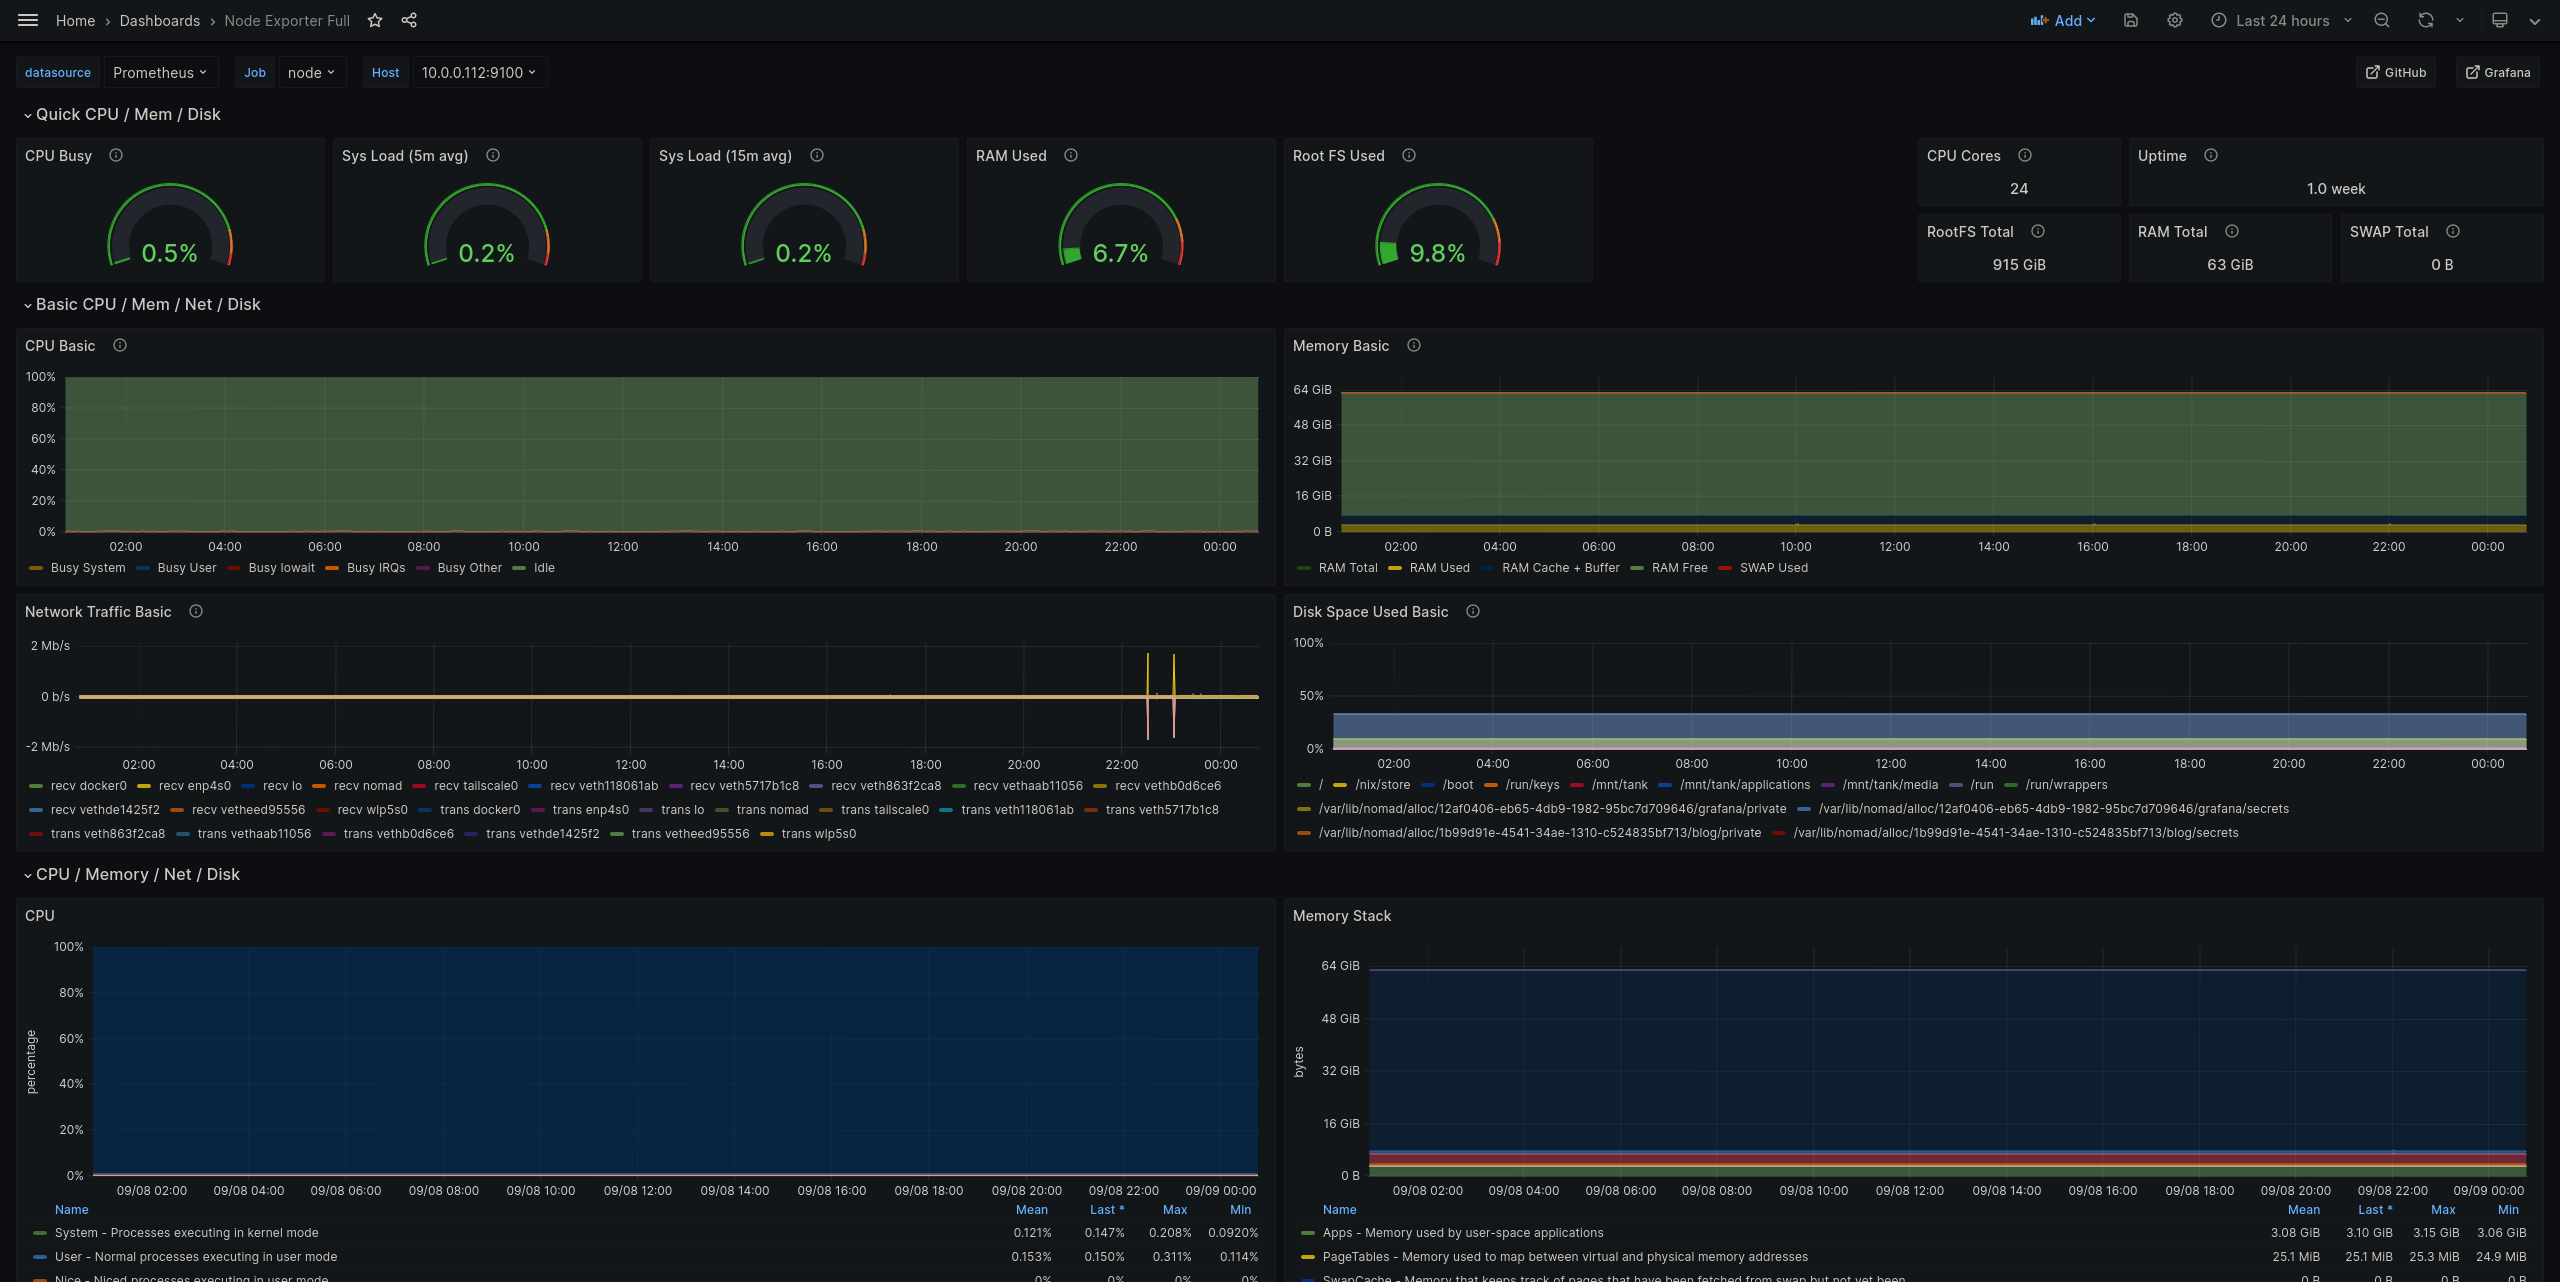 Grafana dashboard for host resource metrics
stackem'
The different components of the system are thus:
- Prometheus
- Grafana
- Prometheus’s node_exporter
- Consul
Here is what I want to collect metrics for, from most critical to least:
- The base host resources. This includes available memory, CPU, disk space, network traffic, etc. Also includes the ZFS pool.
- Nomad itself.
- The services that are orchestrated by Nomad.
tldr prometheus
I won’t go too deeply into how Prometheus works; I wouldn’t be able to do better than the official documentation. That being said, it’s worthwhile to do a quick summary:
- Applications are responsible for presenting their own metrics over HTTP via a dedicated endpoint
- Prometheus operates on a pull based model. As in, Prometheus will reach out and HTTP GET that endpoint for each application in order to “scrape” those metrics and store them
- Prometheus has a massive amount of support for different types of service discovery for automatically registering scrape targets
- Prometheus is a time series database (TSDB) - it is built to store linear, time oriented data that has dimensionality expressed through key-value pairs
base system monitoring
For monitoring the base system, the Prometheus project supports the collection of metrics for Linux based hosts through their node_exporter project. It’s a Golang binary that exposes an absolute treasure trove of data… including ZFS stats!
The exporter project recommends running it outside of a container as it needs a deep access to the host system and the isolation of containers are counterintiutive to that level of access.
While I could run the node_exporter via systemd, I instead opted to use the raw_exec driver for Nomad. There is a Nix package for installing the exporter so the job definition just relies on executing the binary itself. Doing it this way means I get visibility into the exporter process and logs via the Nomad dashboard.
task "node-exporter" {
  driver = "raw_exec"

  config {
    command = "/run/current-system/sw/bin/node_exporter"
  }
}
There is some security implications for enabling the raw_exec driver for Nomad as it will run every process under the same user that the Nomad client is running as - which is usually root. However, it was the path of least resistance and it’s a TODO to later use the exec driver - which uses cgroups and chroot to isolate the spawned process. This, again, is counterintuitive to the node exporter being able to collect data and would require me to make sure that the task allocation has the correct access to the right resources in order to facilitate complete data collection.
service discovery brings all the metrics to the yard
Prometheus has support for a plethora of service discovery methods that can be used to help it locate endpoints for scraping. The integrations range from using simple files to integrating with service meshes. For my homelab, I opted to use the consul service discovery integration because, well, that’s what I’m running.
Whenever a service is deployed to Nomad, it will register an IP address and port to Consul. Prometheus will then talk to Consul to get that address to construct a metrics endpoint and then start scraping metrics an a specified interval.
The configuration for Prometheus looks like this:
scrape_configs:
  - job_name: 'service_metrics'
    consul_sd_configs:
      - server: '{{ env "NOMAD_IP_prometheus" }}:8500'
    relabel_configs:
      - source_labels: [__meta_consul_service]
        target_label: service
Since everything is on the same box, there is no authentication method for Consul and so the only necessary config is the server endpoint. The $NOMAD_IP_prometheus is the IP address for the Prometheus task - which is also the IP address for the homelab server itself because I make liberal use of the bridge networking type. As a quick note, bridge here means that all tasks share a networking namespace but ingress happens over a port bound to localhost for the Nomad client.
The relabel config exists to take the Consul service source label - in this case, the Consul service label is the name of the service that is running on Nomad - and create a target label of service so that every metric is properly tagged. This means that if I deploy a gitea service to Nomad then it gets a service: gitea label in Prometheus.
Additionally, I want to monitor Nomad itself and, well, it so happens that Nomad registers itself with Consul and so it gets collected as well. The only difference is that the metrics_path has to manually changed to /v1/metrics.
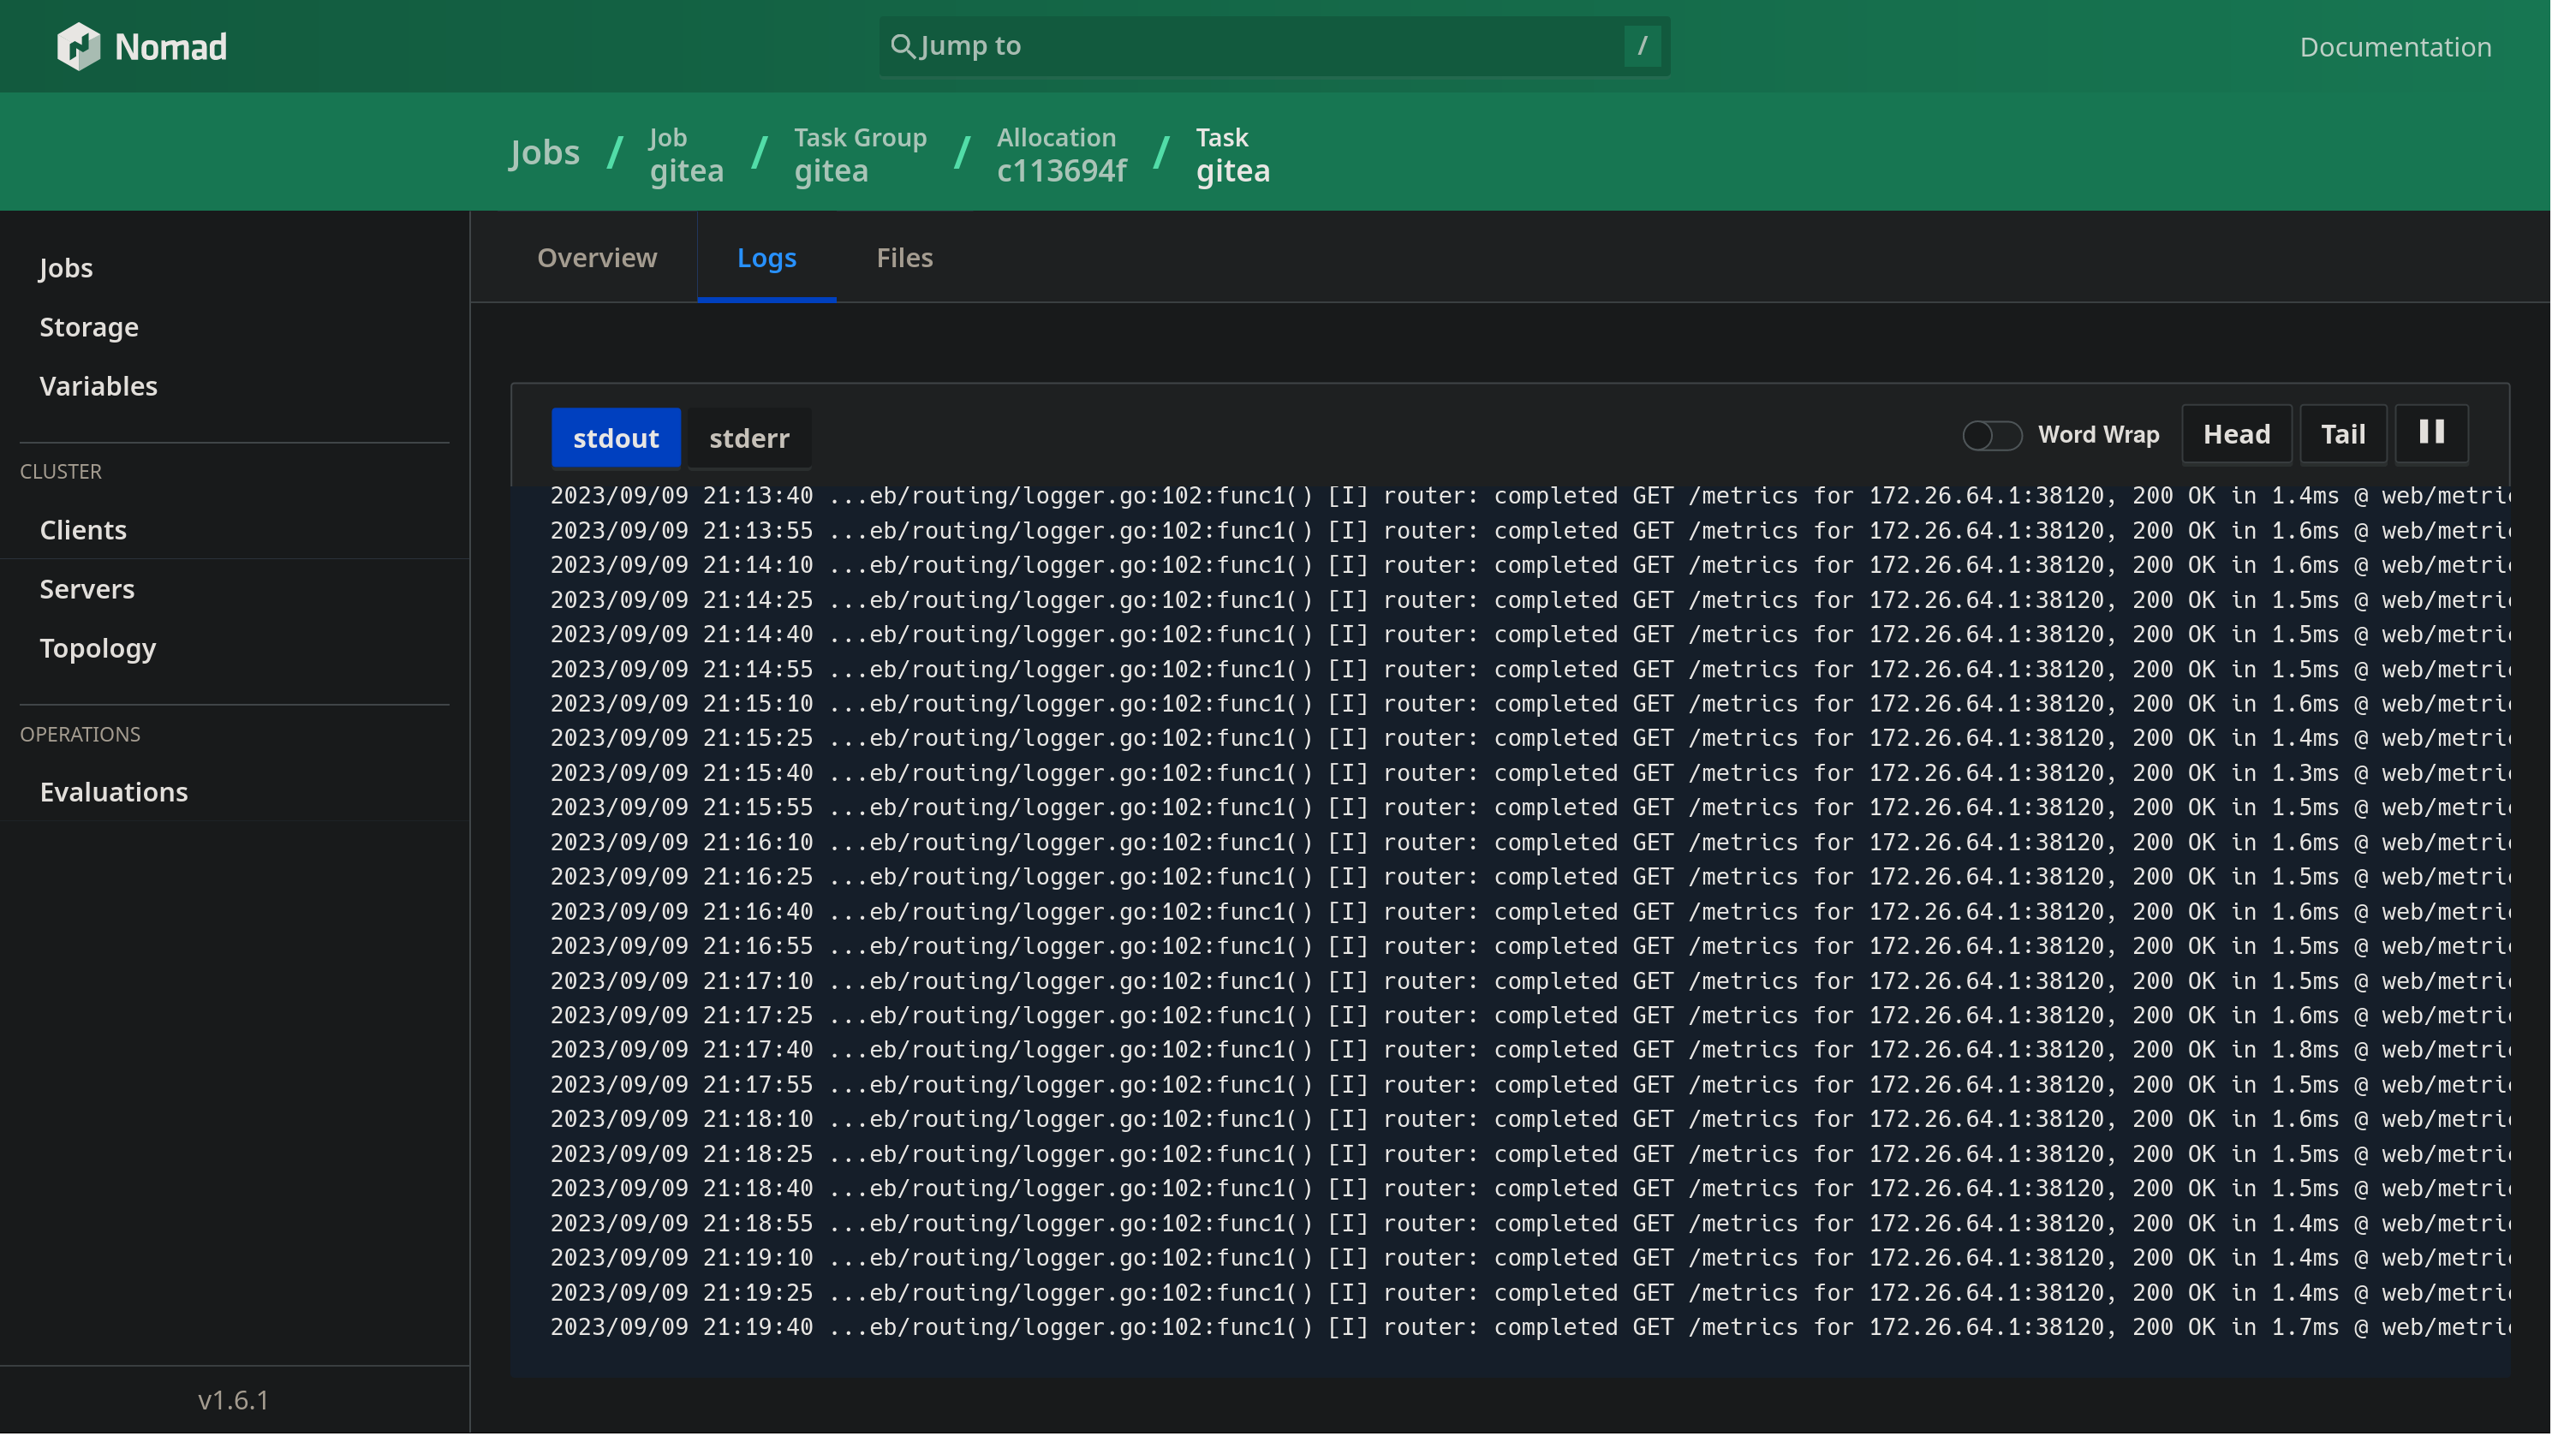
logs are, uh, not done
Logging is incredibly import and it’s on my TODO list to create a better log collection setup but for now I just use Nomad’s log UI.
future todo
Something that I’m excited to play with is using eBPF to construct fine-grained networking monitoring for the box to better monitor traffic flowing between tasks. There is a lot of documentation for this - I just need to clear my calendar for it.
Stay tuned for part 3